Workspace reporting - data and analytics

Just some of our data and analytics standout features
Key behavioural metrics
Space occupancy trends
Detailed reports out-of-the-box
Microsoft BI reporting in Azure
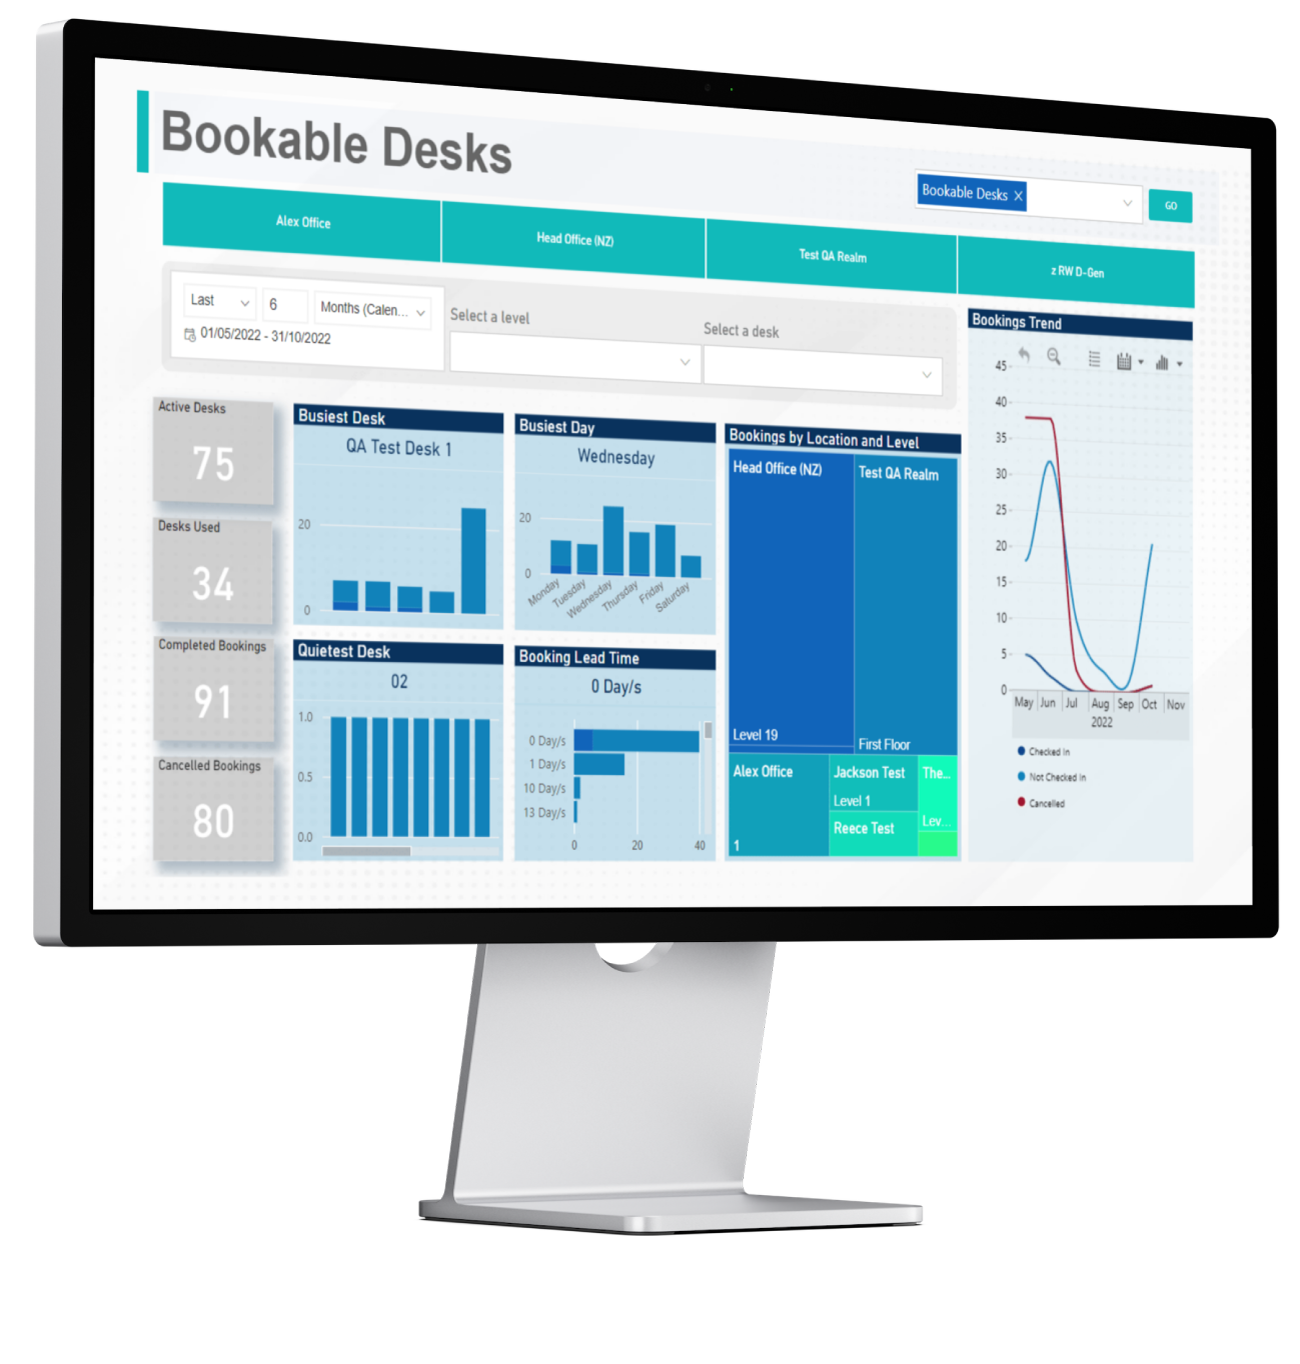
KPI dashboards and graphical reports provide top-down, drillable insights into desk and workspace utilisation, behaviour and trends, allowing you to make informed, data-driven decisions.
Detailed out-of-the-box reports
Get a suite of reports providing dashboard and drill-down insights into user behaviour and space demand. Includes everything from visitors to desk and meeting space utilisation, contact tracing and trend analysis.
Key behavioural metrics
Understand how users are interacting with your meeting rooms, desks and open collaboration spaces with key insights into user behaviour patterns and trends.
Space occupancy trends
Interactive charts enable you to analyse yearly, monthly, weekly, daily and even 15 minute interval trends on individual space, floor or entire building occupancy.
Power BI reporting by Microsoft
Built on one of the largest and fastest-growing business intelligence clouds. Microsoft is a leader in Analytics and Business Intelligence Platforms and powers Space Connect Data Analytics.